Learning Analytics: how to evaluate LMS data and improve the learning process
(or why settle for just completing a course when we can have a more detailed insight into real education)
At a time when most of our activities are gradually going digital, it's a shame to stay with a single number for corporate e-learning: completed - not completed. That's exactly why Learning Analytics exists - a set of methods and tools that allow us to learn much more from the data recorded in an LMS (Learning Management System). How exactly do people learn? What are they most interested in? Which topics are they struggling with the most? And most importantly, how do we translate these findings back into improving the learning process? Find out in our article.
What is Learning Analytics
Learning Analytics is the systematic collection, measurement and analysis of data related to user behavior and learning effectiveness. It doesn't have to be a simple overview of courses completed or test scores achieved. Today's LMSs (whether combined with SCORM, xAPI, or other standards) can also track where a user is most often, how much time they spend on specific activities, or how many times they return to a particular lesson.
The goal of Learning Analytics is to uncover not only that users are learning, but how they are learning, what they are missing, and where there are opportunities for improvement. And that's at the individual, team, and organization level.
Basic metrics and what you can read from them
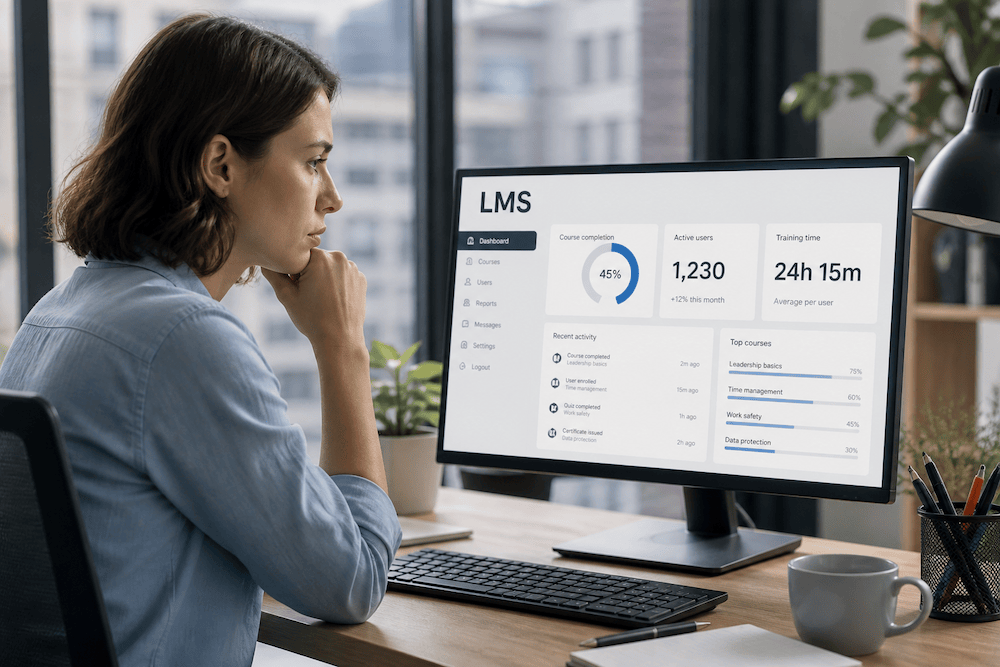
Course Completion Rate
- Basic figure: how many people actually completed a given course.
- It tells you about the motivation or relevance of the course. A low completion rate may indicate boring or unclear content.
Average test scores
- Indicates the extent to which people have mastered a given body of knowledge.
- It is useful to compare between different departments or branches - you may find that some need additional training.
Time spent on course
- If someone completes a course extremely quickly, it may indicate that they already have a good grasp of the material (or have only skimmed over it).
- On the other hand, taking too long suggests that the course is either difficult or unnecessarily comprehensive.
Why settle for average when you can go deep
If you use xAPI and Learning Record Store (LRS), you have a much richer treasure trove of data. xAPI allows you to capture even small interactions like "User watched the video and ended at 52 seconds" or "Discussed the topic at 13:05". This allows you to:
- Identify weak points: For example, find that most people stop watching a video halfway through. Maybe it's too long or doesn't offer enough interactivity.
- Analyse progress: Assess whether individuals (or teams) are improving their performance over time and what activity has helped this happen.
- Personalize content: If you see a user floundering in the "advanced CRM features" section, the system may recommend a complementary micro-course.
How to put analysis results back into practice
1. Edit course content
When you find that some users are not systematically mastering a topic, it's a good idea to simplify the lesson, adding examples or interactive exercises. Often breaking up long blocks into smaller sections will also help.
2. Motivate and engage users
If analytics reveal low completion rates, it's time to incorporate gamification, social elements, or shorten the scope of the lessons. You can also emphasize the importance of the course in relation to work so users see the direct benefit.
3. Create personalized plans
Based on the score or pass rate of each section, you can personalize recommendations for each user. What has he/she already mastered? What else should he or she work on? This reduces learning time but increases efficiency.
4. Involve managers
Learning analytics reports shouldn't just end up with HR or the LMS administrator. Team managers will appreciate seeing insights into where their team can improve and who needs support.
5. Long-term ROI tracking
Learning analytics can also help quantify the ROI of e-learning. When you can see how people's skills increase, you can also link that to work outcomes (improved sales, fewer mistakes).
Tools and tips for analytics
- Built-in features in LMS: Many modern platforms already have clear dashboards, charts and exports.
- Using an LRS (Learning Record Store): If you want xAPI data, you need an LRS that can store and analyze detailed activity records.
- Integration with BI tools: For advanced analysis, you can connect your data to Power BI, Tableau or other BI systems. You get more visualization capabilities.
- Artificial Intelligence: Some platforms already offer AI that learns from big data and can design optimal learning paths.
Learning Analytics can elevate e-learning from a mere "pass/fail" to a truly data-driven process where we understand how people learn and what helps them to perform better. If your employees are spending significant time in the LMS, why not use detailed metrics to make the whole process even more efficient, fun and more focused on real results?
The key is knowing what to track and how to use the data afterwards. If you're in the process of looking around, your benchmarking site can help - look at which LMSs have advanced analytics tools or support for xAPI and LRS, and choose one that will provide useful insights into your employees' learning activities. Because it's only by understanding the actual learning process that we can move forward.